Problem Overview
The Outdoor Industry Association performed a large-scale consumer segmentation report with Egg Strategy, the contents of which compiled pivotal information for retailers and manufacturers in the outdoor industry. Meanwhile, OIA needed a way to present their industry knowledge to their members in a less daunting manner, and in doing so, attract more paying members to their association.
Product Statement
ConsumerVue is a combination web platform and data playground. It is a place for Outdoor Industry professionals to go and learn about the potential consumers of their goods, as well as learn which segments are the most profitable to target in their marketing pursuits. ConsumerVue bridges a gap between OIA and industry retailers and manufacturers, allowing them to offer their industry expertise to paying members as a commodity and a service.

Customer Segmentation
An example of the content from the segmentation report that needed to be organized into an interactive web experience.
My Role
As the sole designer among 3 developers, 1 scrum master, and 2 client stakeholders, I led all aspects of the UX design:
UX Lead
Interface/Interaction Designer
Visual Designer
Information Architect
Creative Director
QA tester
Process
I led the product discovery, including a rapid prototyping session to jump-start requirements gathering. We used the outputs of this session as a guide for designing and building the web application, and remembering the finer details of the user workflow and needs.

Discovery and Rapid Prototyping
Some outputs from the rapid prototyping session that I ran with client stakeholders and my team’s project leads to inform the product requirements, user workflow, and prioritization.

Visual Design
Understanding the research was key. I read, re-read, and thoroughly internalized the 300 page research documentation. I had to become an expert in the Outdoor Industry research in order to bring the data to life in our interactive data showcase. I also had to become an expert in the visual standards of our customer so that I could design a site that seamlessly matched their look and feel.
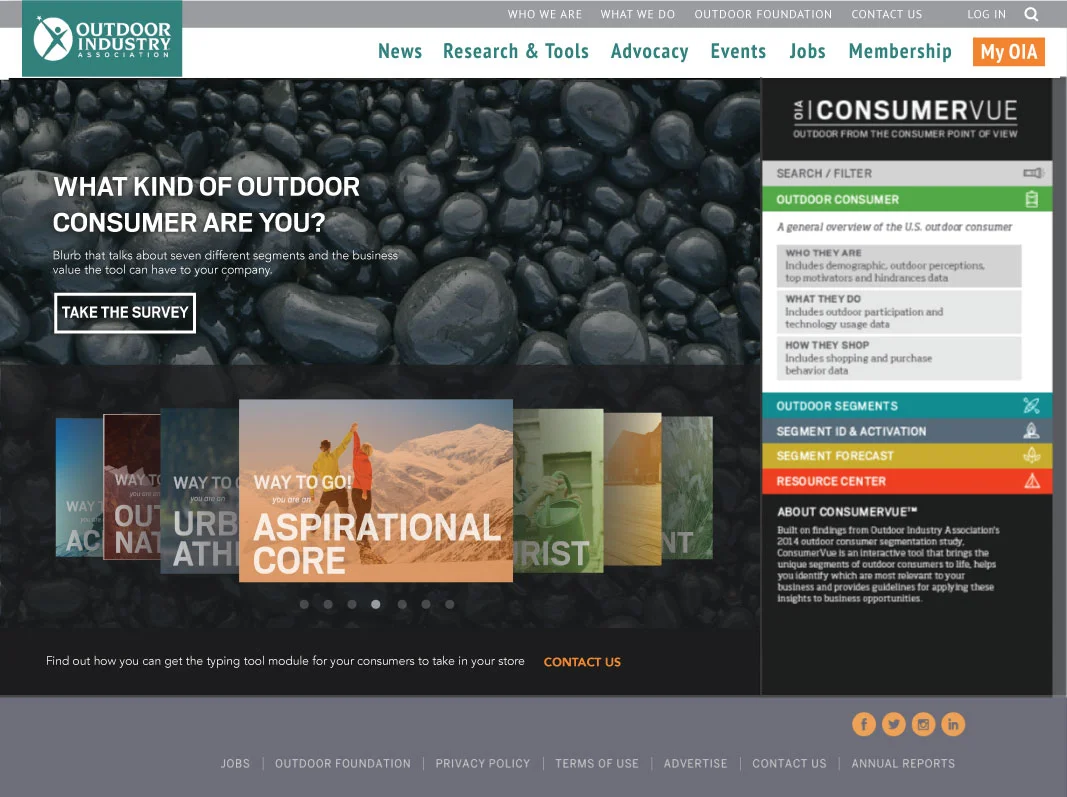
I designed a landing page that incorporated the Outdoor Industry logo, the ConsumerVue product logo, imagery that met their visual standards, and created a visual impact to begin drawing in users and entice them to start scrolling and exploring the data below.

Wireframe Workflows
I used an iterative design approach to define how users would navigate the data before getting into high-fidelity detailed designs. This helped us communicate and collaborate with our client to ensure we had the right pieces before obsessing over the details.

Data Visualization
I created a demographic profile to highlight a large swath of data in a visual and easy-to-interpret manner. I designed iconography and interactive charts to bring the data to life.

Interactive Graphics
To break up the data, I incorporated several interactive page elements, including images with descriptive overlays, videos, and expandable, tabbed information to tell the story of the data in a visual manner.
Data Collection Tool
I designed an iPad-centered data collection tool that OIA could take on the road to the Outdoor Research conference to generate excitement for the web application and allow participants to figure out their consumer type. The landing page allowed them to get an overview of the types before launching the survey.
Style direction, CSS guidance

Likert Survey Design
The survey I designed was based of a Likert Scale. I separated out the questions to not overwhelm users with too many asks in one page, and included a progress bar to illustrate how much was left in the survey.
Challenges
The client had a very tight budget and strict deadline -- our MVP had to be complete by the Outdoor Retail conference in Salt Lake City in late January of 2015. We kicked off the project in November of 2014.
This was the first project this development team had worked with a UX designer
This was my first project working in Agile Scrum methodology
Our development team was brilliant at back end engineering, but less experienced at front end development
The conference atmosphere had limited wifi
OIA was undergoing a rebrand, so branding and visual direction provided by the client was limited and out-of-date, so my work had to be clean and easy-to-be-modified into their future branding system
Impact
My task was to translate the 300 page segmentation report into an accessible, readable, friendly, and and marketable format for members of the Outdoor Industry Association
The website had to not only display a multitude of data, but weave it into an organized, thoughtful story

Custom Roadmap Visualization
One of the infographics I designed highlighted the various phases of the product release, using different elements of color, sizing, and calling out the important information users needed to glean.
End Result
The MVP was launched on an intranet due to limited wifi at the conference
The MVP included contact information collection form for gathering potential users
The MVP included an overview of one of the 7 user segments, plus representation of ⅔ of the 300 page segmentation report
outdoorindustry.org/consumervue
V2 included a segment typing survey
Technology Used
Illustrator, Photoshop
HTML5, CSS3
AngularJS
Chart.js
Lessons Learned
Paired programming for front end development, much CSS
Fast-paced web development
Teaching developers the importance and benefit of UX
Ask me about…
How “Arial” almost ruined everything
How I eased tensions between the stakeholders and the development team
What I would have done differently
If I’d had more time, I would have created a branding standards document up front to ease some of the pains of designing-as-we-built.
I would have also prototyped the entire site before the start of development if I’d had the choice
I’d have taken a more active role in selecting the charting library
I would have set up time-tracking tickets differently, and I would have based them off user stories rather than vague tasks like “create digital assets”, which did not correspond with our project
scope or requirements document
Read the white paper for more information.